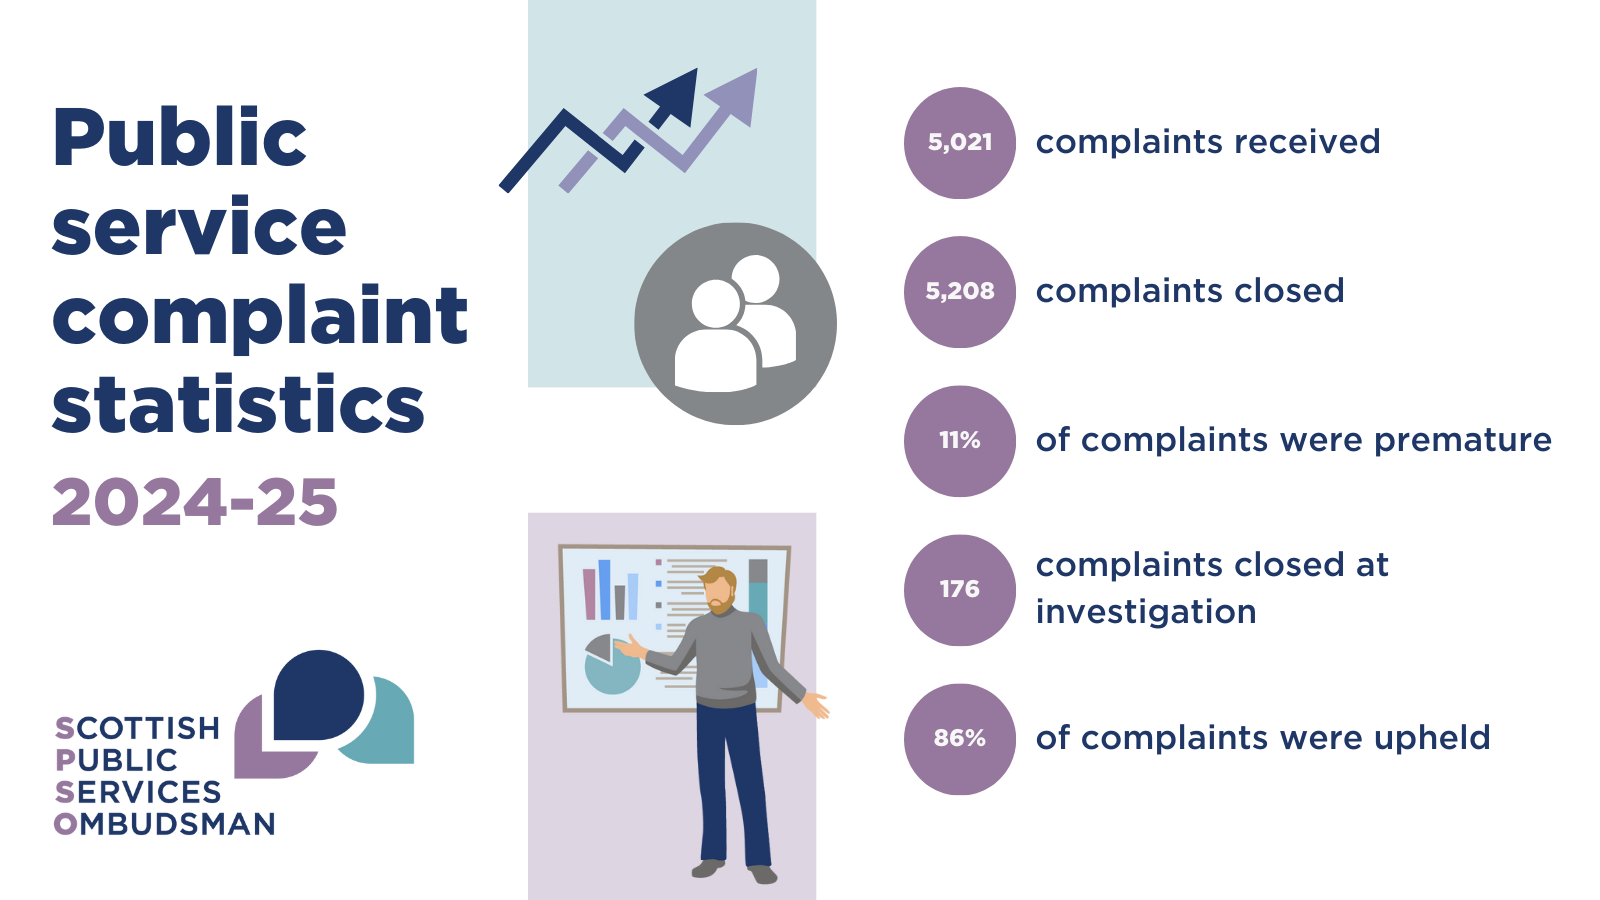
Key figures
- 5,021 complaints received
- 32.1% were about health
- 31.6% were about local government
- 5,208 complaints closed
- 11% of complaints were premature
- 176 cases closed at investigation
- 86% were fully or partially upheld
Annual complaints statistics can be downloaded from the files below. For further information about the descriptions we use in our statistics, please see our explanation of terms.
2024-25 Complaints statistics
- Enquiries and complaints made by subject (Excel, 89KB)
- Enquiries and complaints made by subject (PDF, 585KB)
- Complaints received by subject and authority (Excel, 103KB)
- Complaints received by subject and authority (PDF, 160KB)
- Enquiries and complaints determined by sector and outcome (Excel, 57KB)
- Enquiries and complaints determined by sector and outcome (PDF, 88KB)
- Enquiries and complaints determined by subject and outcome (Excel, 101KB)
- Enquiries and complaints determined by subject and outcome (PDF, 163KB)
- Complaints determined by authority and outcome (Excel, 138KB)
- Complaints determined by authority and outcome (PDF, 170KB)